2020 Investment Portfolio Review
- 7 January 2020
- Mark Pritchard
 We tailor our investment recommendations to meet the needs of our clients and do not 'shoehorn' investors into model portfolios. To show how our investment approach performs we publish quarterly factsheets, the returns from which would not be dissimilar to those received by clients investing in a Black Swan portfolio through an ISA, Investment, Pension or SIPP.
At this time of year we analyse how our example portfolios have performed, make appropriate adjustments and rebalance investment exposure where required. One of the factors we consider in our analysis is the interaction of the underlying investments within each portfolio (cross correlation). Cross correlation is important as it can reduce the risk of investing.
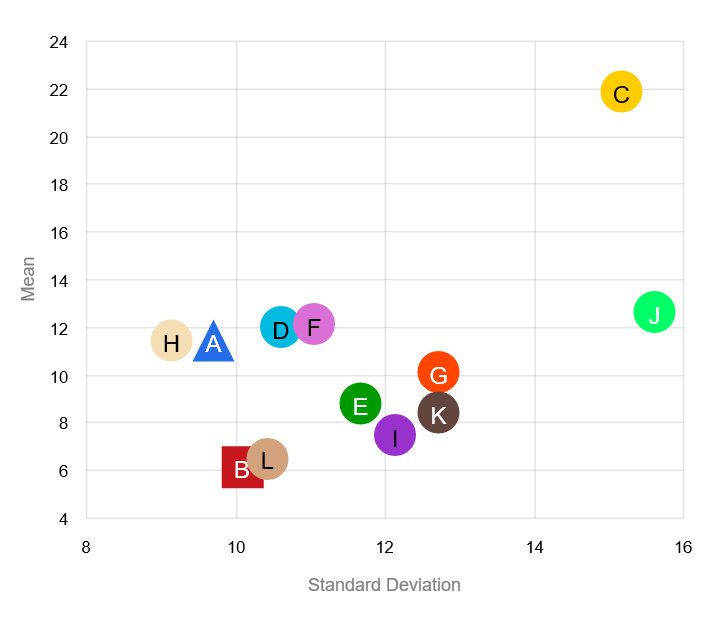
The first picture displays the standard deviation (volatility - a measurement of the movement of an investment from its average monthly return) and returns of the investments (as represented by the coloured dots) over the three year period to January 6 2020. The blue triangle represents the portfolio as a whole and the red square shows the total return from the UK stock market (MSCI UK TR*).
As you can see, the constituents of this adventurous portfolio have generally higher volatility than the UK market, but once cross correlation is taken into account, the volatility of the portfolio as a whole is lower than the UK market.
Net of all fees and charges, the combined return of the investment portfolio over this period equated to 25.67% and the volatility was 9.70%, this compares to the MSCI figures of 17.93% and 10.10% respectively. The portfolio therefore produced a higher return for less risk than the market.
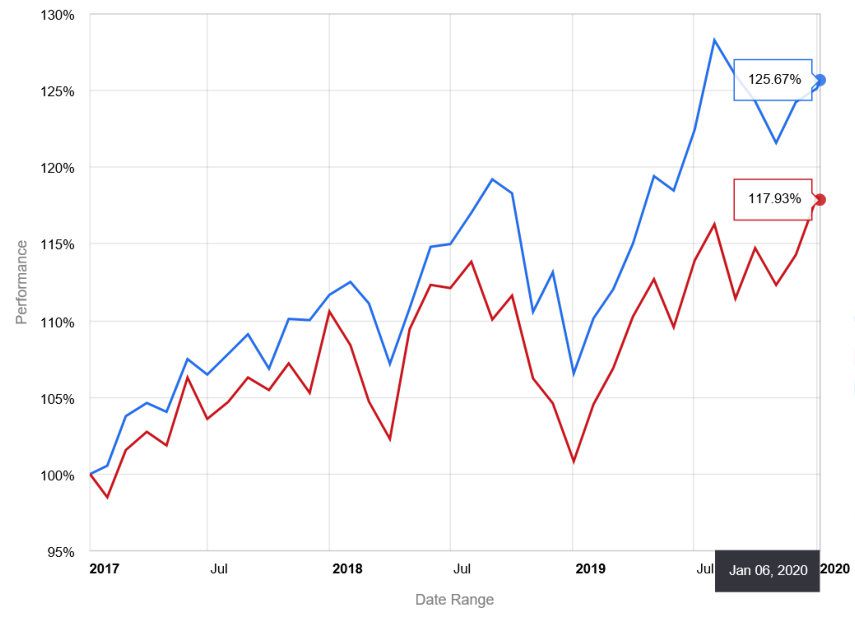 The next picture illustrates the portfolio performance from point to point; with relatively similar volatility it can be seen that the direction of returns from the portfolio (blue line) is closely linked to the market (red line) but produced a higher return.
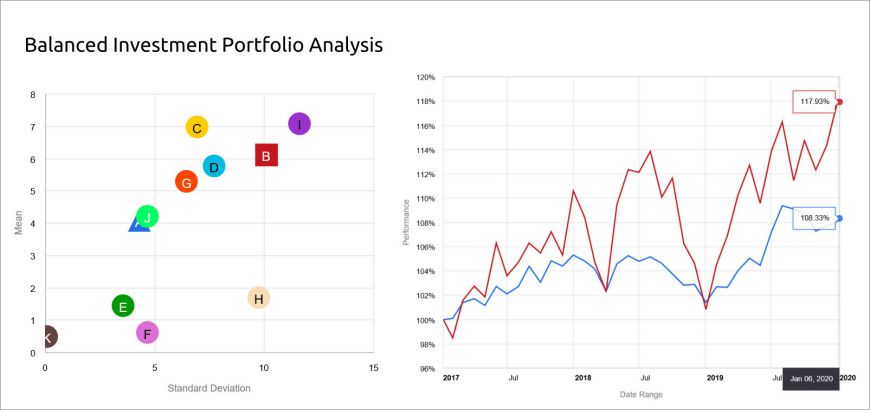
Less adventurous approaches will be more diversified and contain exposure to non-stock market assets, they should therefore be less influenced by market returns.
The following pictures illustrate how our moderately adventurous and balanced portfolios have performed over the same three year period. The peaks and troughs of return are less pronounced and the (blue) line becomes flatter as the risk profile reduces. The numbers behind the charts are: moderately adventurous - return 14.3% volatility 5.60%, balanced - return 8.33% volatility 4.29%.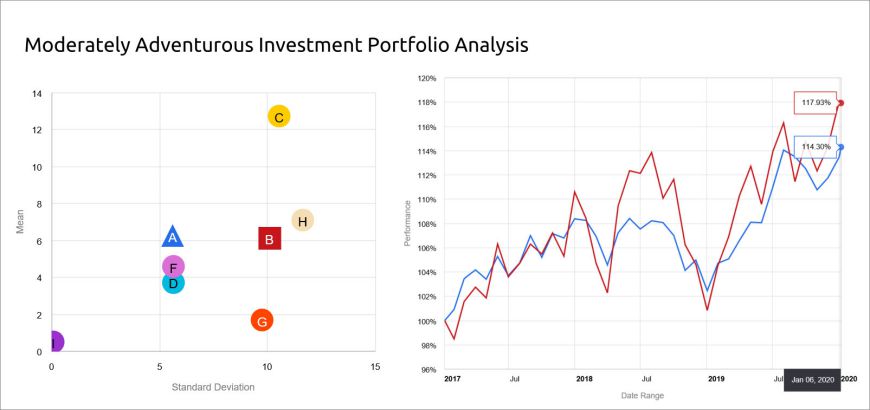
 The analysis we carry out on our example portfolios is replicated for our clients and presented to them during their annual investment review meetings. We present our findings and will then make recommendations depending upon their individual circumstances and requirements.
Readers should note that past performance is not a guide to the future and the value of an investment can go down as well as up, the greater the risk of an investment the greater the potential for loss. There are no guarantees and you might not get back as much as you originally invested.
Whilst the three year period being analysed was generally positive for stock markets the next three years may be less so. Our house view is that having lived with near zero interest rates for over a decade, valuations of many assets are now extremely high, add to this the potentially the toxic effect of excessive global debt levels and the as yet unknown long term consequences of quantitative easing, a sharp market decline may not be too far away.
* Morgan Stanley Capital International UK Total Return index